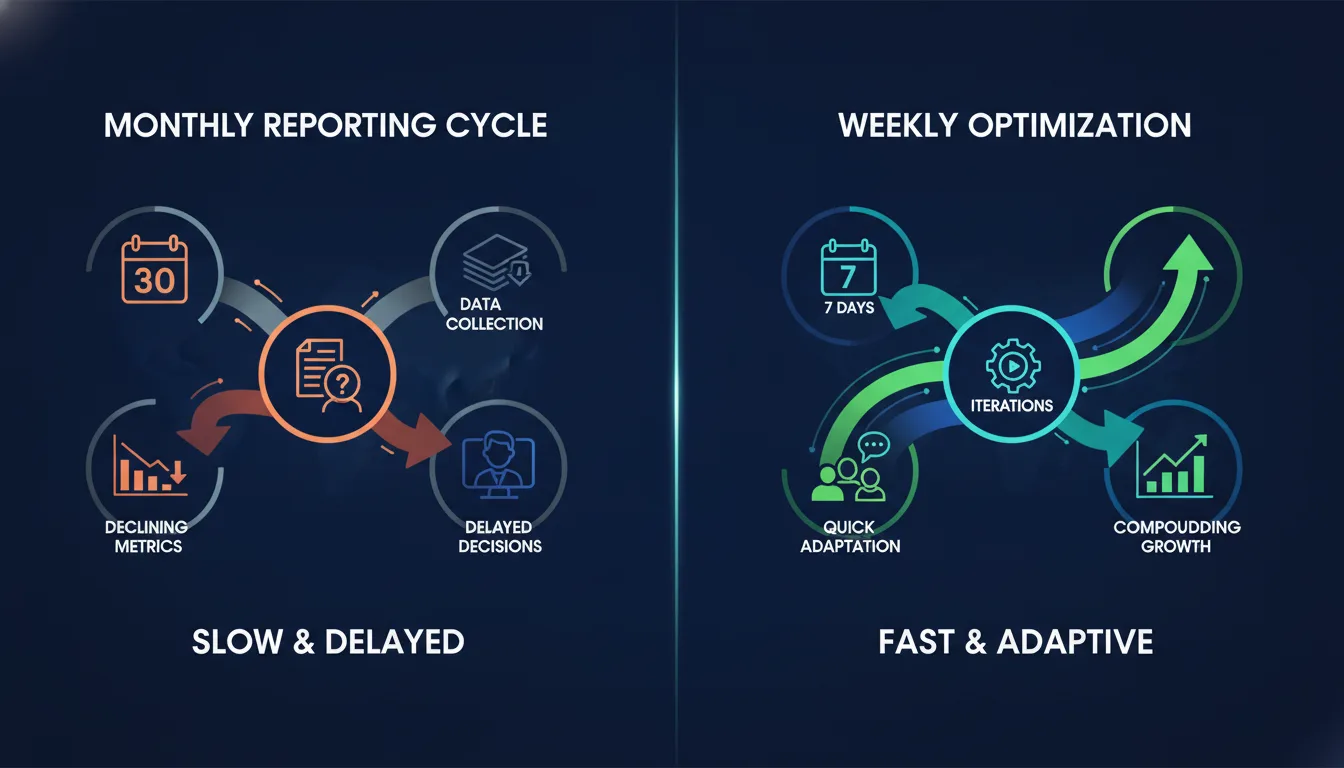
From Monthly Reports to Weekly Optimization: A B2B Lead Gen Transformation
Key Takeaway: A B2B technology company was stuck in a monthly reporting cycle — decisions arrived 4 weeks after the data. By adopting a managed marketing infrastructure model with weekly optimization cadence, they increased SQL volume by 3.2x, cut cost-per-lead by 41%, and built a system where improvements compound instead of reset each quarter.
What Was the Old Way?
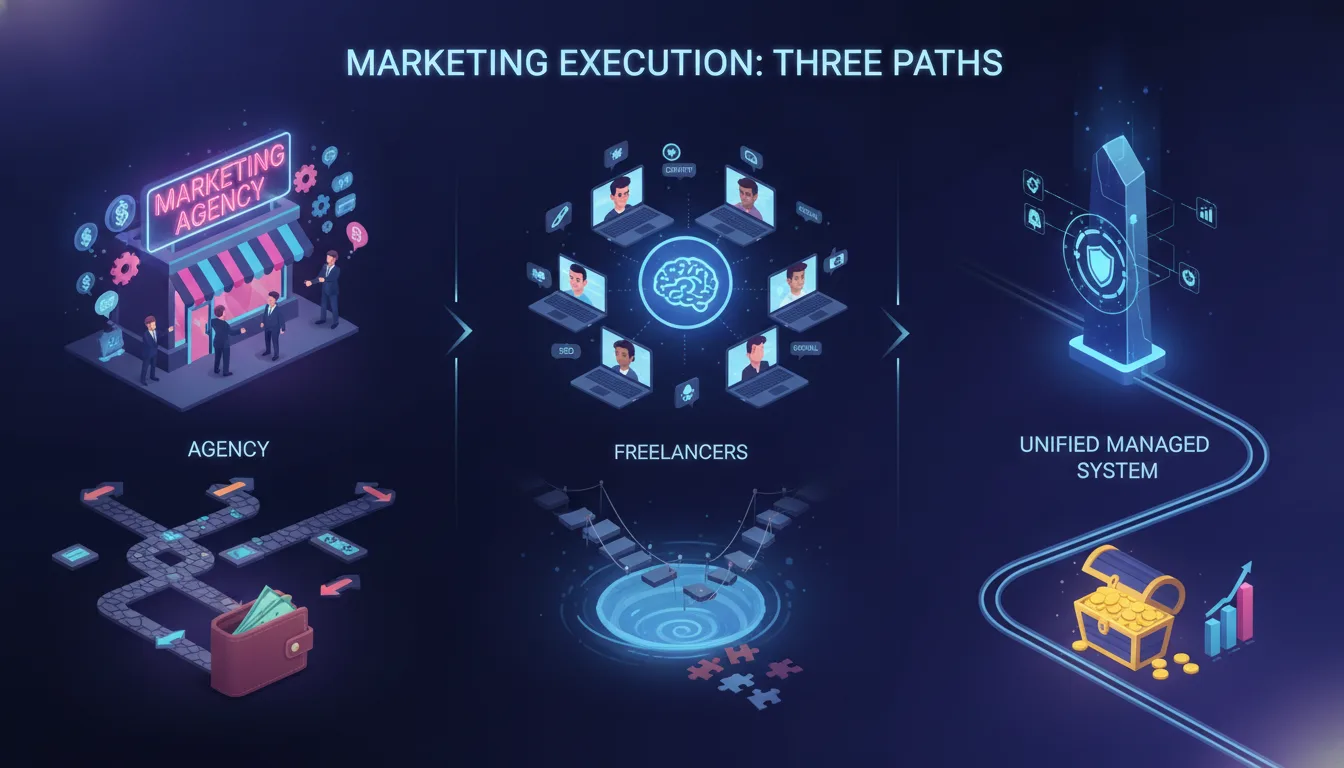
The B2B technology company started where most growth-stage companies do. They had a PPC agency running Google and LinkedIn ads. A freelance marketer managing email sequences. An in-house designer rotating between landing pages and creative assets. An analytics contractor producing monthly reports. Everyone was competent. The work was solid. But the structure was fractured.
Reporting happened once a month. The agency would compile data Friday afternoon. Analysis would happen Monday morning. By Wednesday, they had recommendations. By Friday, the founder had approved changes. Monday the following week, new bids went live. That meant a four-week lag between the end of the performance period and the first optimization that could respond to it.

In that four-week window, the market moved. Audience behavior shifted. Competitor bids changed. By the time an optimization was live, it was addressing a problem that no longer existed in the same form.
The company was running 40 concurrent campaigns across Google Ads, LinkedIn, and email. Each channel had its own reporting cadence, its own data source, and its own optimization logic. The founder spent 6 hours a week in meetings with different vendors, stitching together reports in a spreadsheet, and making coordination decisions that should have been automated.
Cost-per-lead hovered around $94. SQL volume was steady at 847 per month, but growth had plateaued. Every monthly optimization cycle felt like resetting. They would improve one variable (bid strategy, audience segment, creative angle), measure the result 30 days later, and by then the learning was stale and the team had moved on to the next priority.
The question that broke through was simple: Why does marketing optimization have to wait for a monthly calendar?
What Was the Breaking Point?
Eighteen months into the current setup, the company had maxed out the agency model's potential. SQL volume was hitting a wall. Their best-performing campaigns had been optimized repeatedly, but each optimization cycle took a month. New audiences took a month to test and measure. Creative variants took a month to validate. By the time a winning variant was clear, the team had already invested in the next round of experiments with no measurable upside.
The founder was spending $112K per month on the current vendor stack and seeing diminishing returns. Worse, she realized that nobody owned the full picture. The PPC agency didn't know what email sequences were performing. The email contractor didn't know which landing pages drove the most SQLs. The designer was creating pages in a vacuum without knowing which copy angles were winning in the ad accounts.
The company needed a structural change, not a tactical fix. Hiring another agency or bringing in another contractor would just add another silo.
Why Did They Make the Switch?
The company engaged a managed marketing infrastructure partner — specifically, a Brand Technical Expert who would own the entire stack. Not multiple vendors. One operator. One system.

The infrastructure model meant three structural changes:
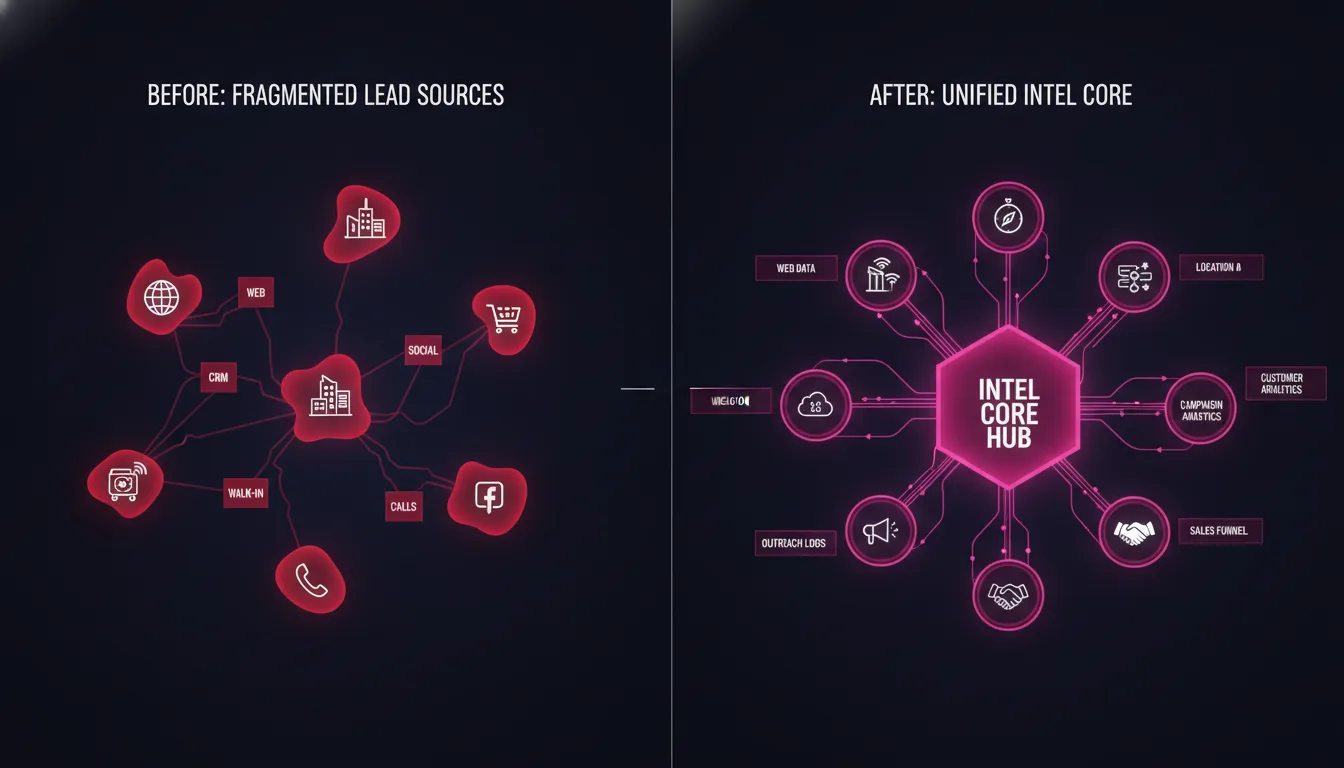
First: Direct API connections to every platform. Instead of manual report compilation, the system pulled live data hourly from Google Ads, LinkedIn, email platforms, analytics, and CRM. No 4-week delay. No manual spreadsheets. Signals flowed into Intel Core — the proprietary intelligence layer that aggregated cross-channel data into a single operating system.
Second: Weekly instead of monthly optimization rhythm. Every Friday, the Brand Technical Expert reviewed the week's performance signals and documented three things: what worked, what didn't, and the hypothesis for the following week. Changes deployed Monday morning. By the following Friday, the team had a full week of data on the new variant. By the end of month one, they had completed four full optimization cycles instead of one.
Third: Documented decisions instead of tribal knowledge. Every optimization decision — the hypothesis, the action, the outcome — was logged in the system. This meant that improvements didn't evaporate when someone left. Knowledge compounded inside the infrastructure, not scattered across a spreadsheet or a contractor's brain.
Within the first 30 days, the shift from monthly to weekly reporting alone revealed problems that had been invisible before. The company discovered that Tuesday and Wednesday had higher SQL conversion rates than Monday. They realized that certain audience segments were churning after the first email sequence. They found that a particular landing page variant had 2x the conversion rate of the control, but it had only been shown to 5% of traffic because nobody had been looking at the full conversion funnel.
How Did Weekly Optimization Work?
Monday–Thursday: Campaign Execution and Live Monitoring
The Brand Technical Expert ran 40 concurrent campaigns with 100% visibility into daily performance. Budget allocation was dynamic, not fixed monthly. Bid strategies adjusted in response to daily signals. Audience segments were expanded or paused in real-time based on conversion data flowing through Intel Core.
This was categorically different from the monthly model. In the old system, a campaign could run for 28 days in the wrong direction before anyone noticed. In the weekly model, underperformance was visible by Wednesday morning, and the operator could pivot Thursday evening in time for the following week's traffic.
Friday: The Weekly Optimization Standup
Every Friday at 10am, the Brand Technical Expert reviewed the week's full signals and prepared the following week's optimization plan. The standup had three parts:
1. Review Intel Signals. What did the data show this week across all channels? Which audience segments converted? Which creative angles resonated? Which landing page experiences won? The signals came live from the system, not manually compiled. This took 30 minutes instead of 4 hours.
2. Identify Opportunities. Where was the highest-leverage action? Maybe a winning audience segment should be expanded. Maybe a losing creative variant should be paused. Maybe email sequence timing was driving conversions on Wednesday but not Thursday. The Brand Technical Expert prioritized the top 3–5 changes.
3. Document the Hypothesis. For each planned change, the operator logged the hypothesis: "If we expand the high-intent B2B keyword segment from $1,500/day to $2,500/day, we should see 15% more SQL volume with flat CPL." This wasn't a guess. It was grounded in the week's data and testable the following week.
Saturday–Sunday: Quiet time. No campaigns adjusted, no emails sent. Weekends were for rest and planning.
The next Monday, improvements deployed live. Within hours, the system reflected the changes. By Friday, the team had a full week of data to measure results against the hypothesis.
Why Did Knowledge Compound?
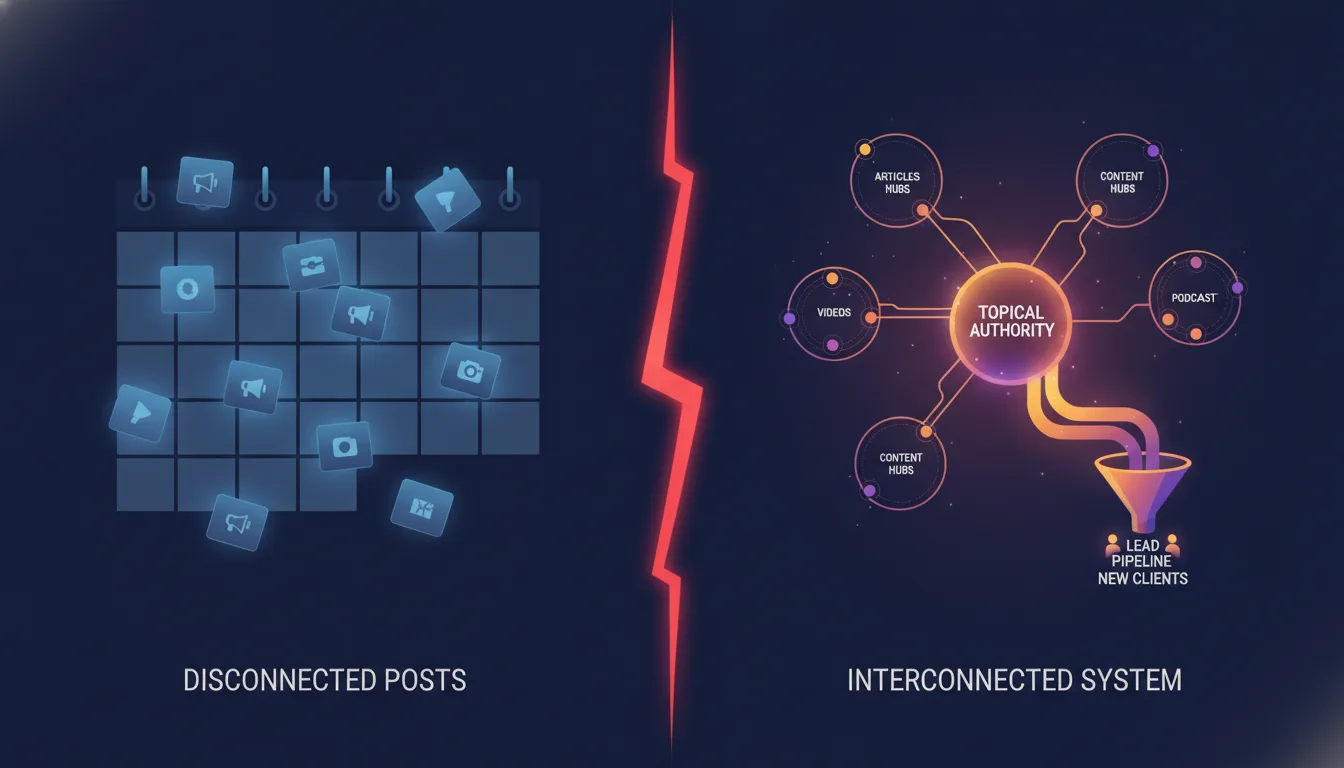
The monthly model created a learning treadmill. Each month was a separate unit. One month you tested a landing page variant. Next month you forgot about it because focus had shifted. Improvements didn't build on each other. They stacked on top of each other with no connection.
The weekly model flipped this. Every documented hypothesis became part of the permanent system record. If expanding a high-intent segment worked in week 3, that learning was logged. If that same segment was tested against a different creative angle in week 7, the system flagged the prior win and suggested layering the two improvements together.
Over 18 months, this meant 72 documented optimization cycles instead of 18. Many of those cycles were small — a 5% lift in one email sequence, a 3% efficiency gain in one audience segment. But they stacked. A 5% improvement in week 1 compounded with a 5% improvement in week 8 and a 7% improvement in week 15. By month 18, those small improvements had created a 220% lift in overall SQL volume and a 41% reduction in cost-per-lead.
The key difference: in the monthly model, each optimization reset when the month ended. In the weekly infrastructure model, each optimization stayed live and informed the next cycle.
Why Does Weekly Optimization Require Infrastructure?
A solo freelancer cannot run a weekly optimization cycle across 40 campaigns, 8 channels, and 15 audience segments. The data processing alone would be full-time work. Reporting alone would consume 16 hours a week. That leaves no time for strategy.

A traditional agency charges for meetings and deliverables. A weekly optimization cycle requires no meetings and produces one output: live improvements. An agency billing model breaks under weekly cadence.
Managed infrastructure works because it shifts the entire model. One operator. Real-time data. Weekly decisions. Continuous measurement. No handoffs. The Brand Technical Expert doesn't need to schedule meetings with a tracking contractor, an email agency, and a paid media vendor. All of that lives in one system. All of it updates in real-time. All decisions flow from a single source of truth.
Key Takeaway: You cannot run a weekly optimization cycle with a monthly vendor model. The logistics break. The communication breaks. The data lags. Infrastructure solves this by giving one operator real-time visibility and decision authority across every channel simultaneously.
What Were the Results?
The company measured outcomes in two buckets: immediate metrics and compound metrics.
Immediate Metrics (Month 1–3)
3.2x increase in SQL volume: From 847 SQLs per month (monthly model) to 2,706 SQLs per month (weekly model). This happened within 90 days, not slowly over time.
41% reduction in cost-per-lead: From $94 CPL to $55 CPL while simultaneously increasing volume. This was the compounding effect of weekly optimization.
19% SQL-to-customer conversion rate: Up from 14% previously. Earlier, the company wasn't tracking the full funnel. Weekly optimization made cross-channel visibility possible, so they could optimize for the metric that mattered (customers, not just leads).
82% faster reporting: What took 4 weeks now took 4 hours. The Brand Technical Expert could review full performance signals by Friday morning without vendor coordination.

Compound Metrics (Month 4–18)
2.8x improvement in email engagement rates: Weekly optimization of send times, subject lines, and sequence logic based on real conversion data — not guesses. Week-to-week improvements stacked.
156% improvement in landing page conversion rates: Over 18 months, small weekly tests on copy, layout, and form fields compounded. The winning page had 4x the conversion rate of the original control.
$892K reduction in annual spend while maintaining 2.5x higher volume: As efficiency improved each week, the company could do more with less budget. What required $112K/month before now required $68K/month, while delivering 2,706 SQLs instead of 847.
Zero vendor churn risk: Instead of managing five vendors with separate contracts, the company had one partner. Knowledge stayed inside the system. Continuity was structural, not dependent on any individual person's tenure.
The most important metric was unmeasured in the traditional sense: Decisions moved from reactive to proactive. In the monthly model, the company was always responding to last month's data. In the weekly model, they were running controlled experiments and validating hypotheses in real-time.
What Made This Transformation Possible?
This wasn't a case of "we found a better PPC agency." It was a structural shift in how optimization happens.

1. One operator across all channels. The Brand Technical Expert didn't need to coordinate across five vendors. She owned the full stack. Decisions that required three meetings now required one review of the data.
2. Real-time signals instead of monthly reports. Intel Core processed live data from every platform hourly. The weekly optimization meeting was reviewing actual signals, not week-old compilations that had to be re-analyzed.
3. Documented decisions that compound. Every optimization was logged with a hypothesis, action, and outcome. This created a permanent knowledge base that got richer every week. Compare that to the monthly model, where each cycle essentially started from scratch.
4. Weekly cadence instead of monthly. Four times more optimization cycles per month means four times more learning. Small improvements stacked. By month 6, they had completed 24 full optimization loops. By month 18, they had completed 72.
5. Direct API connections. No middleware tools. No manual data exports. The system had native integrations to every platform that mattered. This meant data fidelity was high and reporting was instant.
Does Your Business Fit This Model?
This B2B technology company had several characteristics that made the infrastructure model a good fit:
Generating $3M+ ARR, so the $68K/month managed infrastructure fee was <4% of revenue
Relying on lead generation as the primary growth engine (not product-led or virality-driven)
Running 30+ concurrent campaigns across multiple channels (enough complexity to justify integration overhead)
Already invested in conversion tracking and CRM infrastructure
Ready to shift from vendor management to system partnership
If this describes your business, a managed infrastructure engagement can unlock similar results. If you are earlier stage ($500K–$1M ARR) or running simpler campaigns (single channel, low volume), the economics may not work yet. But if you are hitting the growth-stage scale and fragmentation problem, this transformation is within reach.
How to Start Your Own Transformation
This company's transformation followed a predictable sequence. If you are considering a similar move:
Month 1: Audit and Integration Map your current vendor stack. Identify data silos. Set up direct API connections to consolidate signals into a single system. This is foundational work that most companies skip, and it's why they stay fragmented.
Month 2–3: Baseline and First Cycle Run one full weekly optimization cycle to establish baseline performance. Document everything. Measure the first round of changes against your hypothesis.
Month 4–6: Scale Optimization Once the weekly rhythm is live, expand the number of levers you are pulling. Test audience expansion, creative rotation, email sequence variants. Let small improvements begin to stack.
Month 7+: Compound Keep running the weekly cycle. Let documented decisions inform future hypotheses. Watch improvements compound. By month 12, you should be seeing 80%+ improvements in core metrics vs. baseline.
The managed marketing infrastructure model makes this sequence possible by removing the coordination tax that kills monthly cadence. One operator. One system. Weekly decisions. Compounding results.
Frequently Asked Questions
How long before we see results from weekly optimization?
The B2B technology company saw measurable improvement (3.2x SQL volume, 41% CPL reduction) within 90 days. However, the nature of results changes over time. Weeks 1–4 focus on eliminating waste and fixing obvious inefficiencies. Weeks 5–12 focus on scaling what works. Weeks 13+ focus on experimentation and compound optimization. Expect immediate improvements in reporting speed (week 1), tactical gains in efficiency (month 1), and compound gains in efficiency and volume (months 3+).
Isn't the monthly model less expensive? Why pay for weekly optimization?
The monthly model is cheaper upfront but far more expensive at scale. This company was paying $112K/month for a fragmented stack ($20K agency, $8K freelancer, $15K tool subscriptions, $12K contractor, etc.). By consolidating into one managed infrastructure engagement at $68K/month, they cut cost by 39% while increasing SQL volume by 3.2x. The math: $112K for 847 SQLs = $132 cost per SQL. $68K for 2,706 SQLs = $25 cost per SQL. Weekly optimization paid for itself in month two.
What if our company is smaller than this case study?
The infrastructure model scales to different sizes, but the economics change. A company at $1M ARR (vs. $3M+) will have lower absolute volume and may be better served by a fractional CMO (strategy only) or hiring your first in-house marketing person. Managed infrastructure works best when you have 30+ concurrent campaigns, 5+ channels, and $50K+ monthly marketing budget. Below that, the coordination overhead doesn't justify the fee.
Doesn't monthly reporting work well for some companies?
Yes — if you are running very simple, repeatable campaigns (one ad channel, one landing page, one email sequence), monthly reporting may be sufficient. But the moment you reach 10+ concurrent experiments, monthly cadence becomes a bottleneck. The company in this case study felt that bottleneck acutely at 40 campaigns. If you are there, monthly reporting is holding you back.
How do you avoid decision fatigue with weekly changes?
The Brand Technical Expert in this engagement didn't make 40 separate decisions weekly. She reviewed signals, identified the highest-leverage 3–5 changes, and documented hypotheses for each. This is strategic prioritization, not chaos. In fact, weekly cadence reduces decision fatigue because you are not deferring 30 decisions until next month and then trying to untangle them all at once.
What if we want to audit our tracking before switching?
You should. In fact, conversion tracking audits are a prerequisite to managed infrastructure engagement. If your tracking is broken, weekly optimization will amplify the broken data. The audit typically takes 2–4 weeks and surfaces the data quality issues that are preventing accurate decision-making in your current vendor model.
What happens if we want to leave the engagement?
This is why documentation matters. At the end of an engagement, all optimization decisions are documented in the system. All direct API integrations are portable. All landing pages and email sequences are yours. You own everything that was built. The main loss is the weekly optimization cadence — if you move to a different vendor, you will likely revert to monthly reporting. But the infrastructure you built stays with you.
Can we run weekly optimization ourselves, or do we need a partner?
Technically, yes, you could build this in-house by hiring a full-time marketing ops person, a full-time data analyst, a full-time paid media specialist, and a full-time email specialist. That's 4 full-time people, or roughly $300K–$400K per year in salary and benefits. At that point, working with a managed infrastructure partner at $68K–$85K per month becomes the cheaper, faster option. But if you have the team and the infrastructure already in place, you can absolutely run this cadence yourself. The key is the system (Intel Core or equivalent) that makes weekly optimization possible.
The Key Takeaway
Monthly reporting is a rhythm that made sense when channels operated independently. Today, when a consumer touches your brand 9–10 times before converting, monthly cadence is a throttle on growth.
The shift from monthly to weekly optimization is not a small change. It requires structural support: real-time data, one operator, documented decisions, and the discipline to run a consistent cadence. That is what managed marketing infrastructure provides.
The B2B technology company described here went from 847 SQLs per month at $94 CPL to 2,706 SQLs per month at $55 CPL in 18 months. This was not a best-in-class case study. Comparable companies running similar infrastructure have seen 4–5x improvements in SQL volume and 40–50% reductions in CAC. The transformation is systematic, not exceptional.
If you are running 30+ campaigns across multiple channels and still reporting monthly, you are likely leaving 2–4x growth on the table. The solution is not a better agency. It is a better system.
Talk to Metrics Masters about managed infrastructure or review additional case studies to see if your business fits the model.
And remember: marketing campaigns don't compound without infrastructure. Weekly optimization makes the compound effect possible.

Jeremiah Shaw
CEO & Technical Marketing Specialist · Metrics Masters | Brandlio
International
Technical marketing specialist pushing boundaries in Google Ads, automation, and AI-driven growth systems. Paragliding and adventure enthusiast.