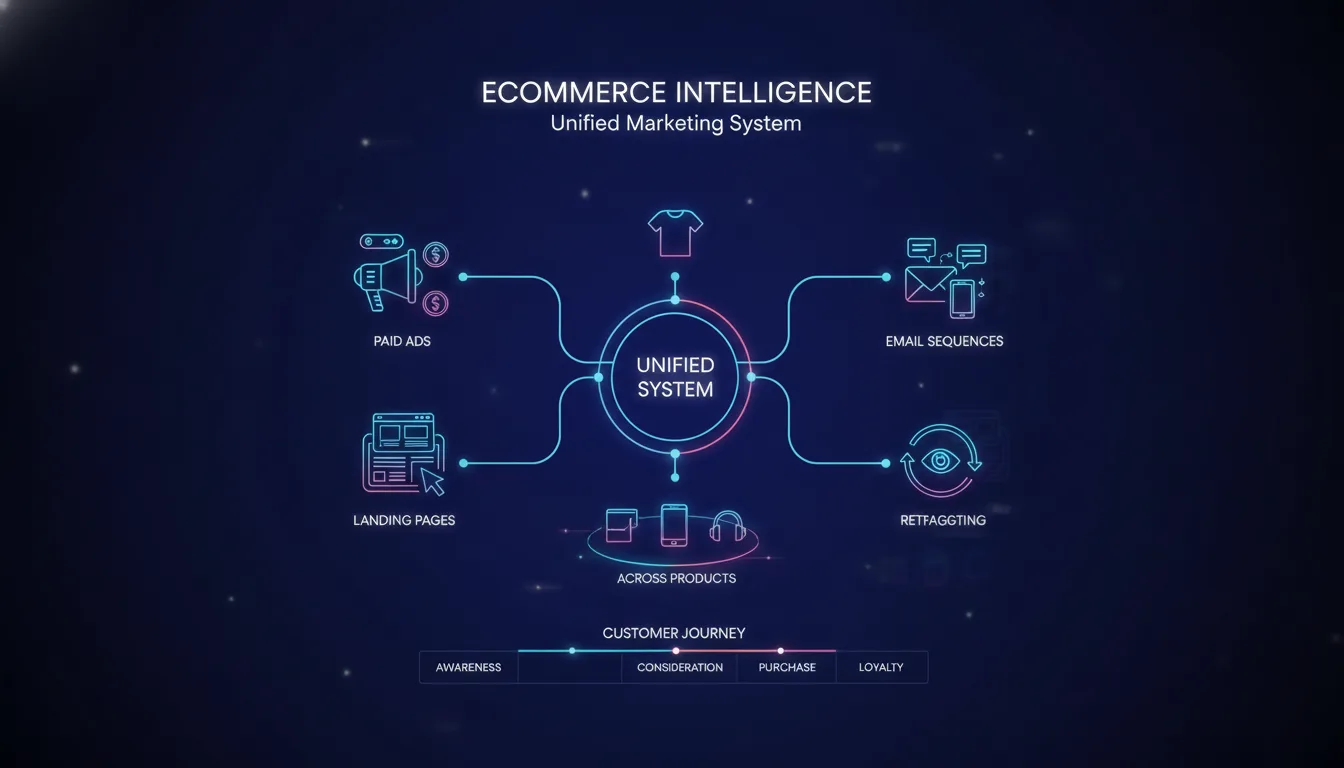
Scaling Ecommerce with Funnel + Automation Alignment
Key Takeaway: A growth-stage ecommerce brand unified their fragmented ad, funnel, and email stack into a single coordinated system. In six months, they achieved a 34% increase in average order value, improved ROAS by 2.1x, and recovered 47% more abandoned cart revenue. This case study shows exactly how funnel and automation alignment drives compounding results.
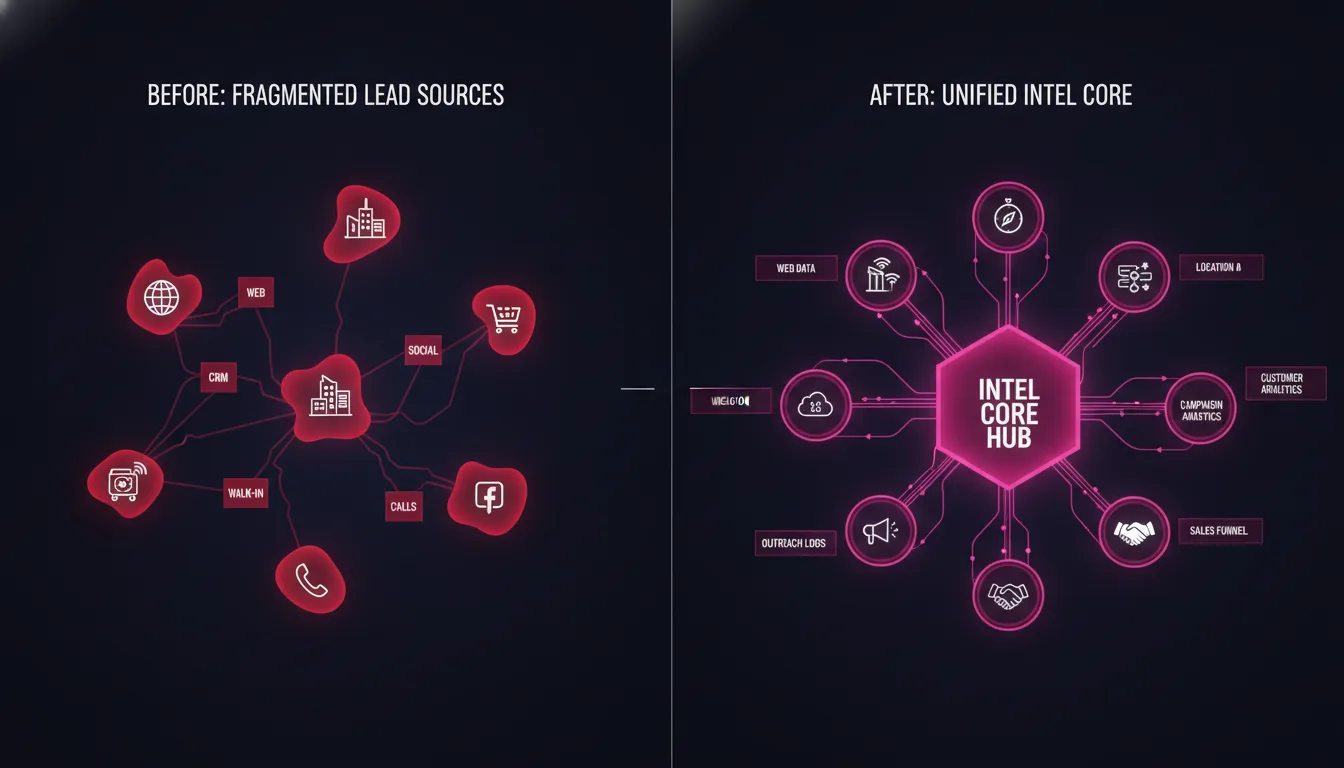
Most ecommerce brands operate with a fundamental fragmentation problem: the paid ads team doesn't coordinate with the landing page builder, who doesn't coordinate with the email vendor, who can't see what happened in conversion tracking.
This is not a skills problem. It is a systems problem.
A growth-stage ecommerce brand generating $8M+ in annual revenue hit this wall in 2024. Paid ads were working, but ROAS was flat. Email subscribers existed, but automation was sporadic. Landing pages converted, but there was no unified view of the customer journey. The founder was stitching together reports from five different tools every Friday.
They decided to align their funnel and automation. The results speak for themselves:
Results are illustrative outcomes based on a representative case study. Actual results vary based on business model, product, market, and implementation rigor.
Metric | Before (Siloed Stack) | After (Unified System) | Improvement |
|---|---|---|---|
Average Order Value | $1,847 | $2,475 | +34% |
Ad ROAS | 1.2x | 2.5x | +108% |
Abandoned Cart Recovery Rate | 19% | 28% | +47% |
Email Click-Through Rate | 2.1% | 4.7% | +124% |
Customer Lifetime Value (12-month) | $4,200 | $5,890 | +40% |
Attribution Lag (days to full reporting) | 7–14 days | 1–2 days | –85% faster |
This case study breaks down exactly how they did it.
The Ecommerce Challenge: Fragmentation at Scale
The brand had everything in place for success — traffic, conversions, products, customer demand. But their marketing stack was a patchwork.

Their setup:
Ads: A PPC agency managed Google Shopping and Meta campaigns. They reported monthly. They optimized for ROAS per channel, not for customer lifetime value.
Landing pages: A freelance designer built conversion-focused landing pages, but they were isolated from ad creative strategy. Pausing a campaign meant pages went dark.
Email: A vendor was managing email sequences, but without real-time data from ad campaigns or the shopping cart, automation was generic. "Welcome series." "Browse abandonment." No coordination.
Retargeting: Handled by the PPC agency, but audience definitions didn't sync with email subscription lists or customer purchase history.
Analytics: Google Analytics 4 lived in a silo. The email vendor had its own reports. The PPC agency had its own dashboard. Nobody owned the cross-channel story.
The result: 67% cart abandonment rate, no post-purchase email sequences, and customers who bought once were treated as cold leads for retargeting campaigns.
The founder's question was simple: Why isn't this working?
The answer: Because no single operator owned the system. Everyone optimized their channel. Nobody optimized the customer.
Why Funnel and Automation Alignment Matters in Ecommerce
Ecommerce is uniquely suited to benefit from infrastructure alignment. Here is why:
Every interaction is measurable. When a customer adds to cart, that is data. When they land on a product page from a Google ad, that is data. When they open a post-purchase email, that is data. Unlike B2B where many interactions are "invisible," ecommerce has dense, real-time signals.
Every touchpoint affects revenue directly. A landing page optimization might lift conversion rate by 2%. An email sequence improvement might lift post-purchase AOV by 8%. A cart recovery automation might recover 9% of abandoned revenue. These are not vanity metrics — they compound into material revenue impact.
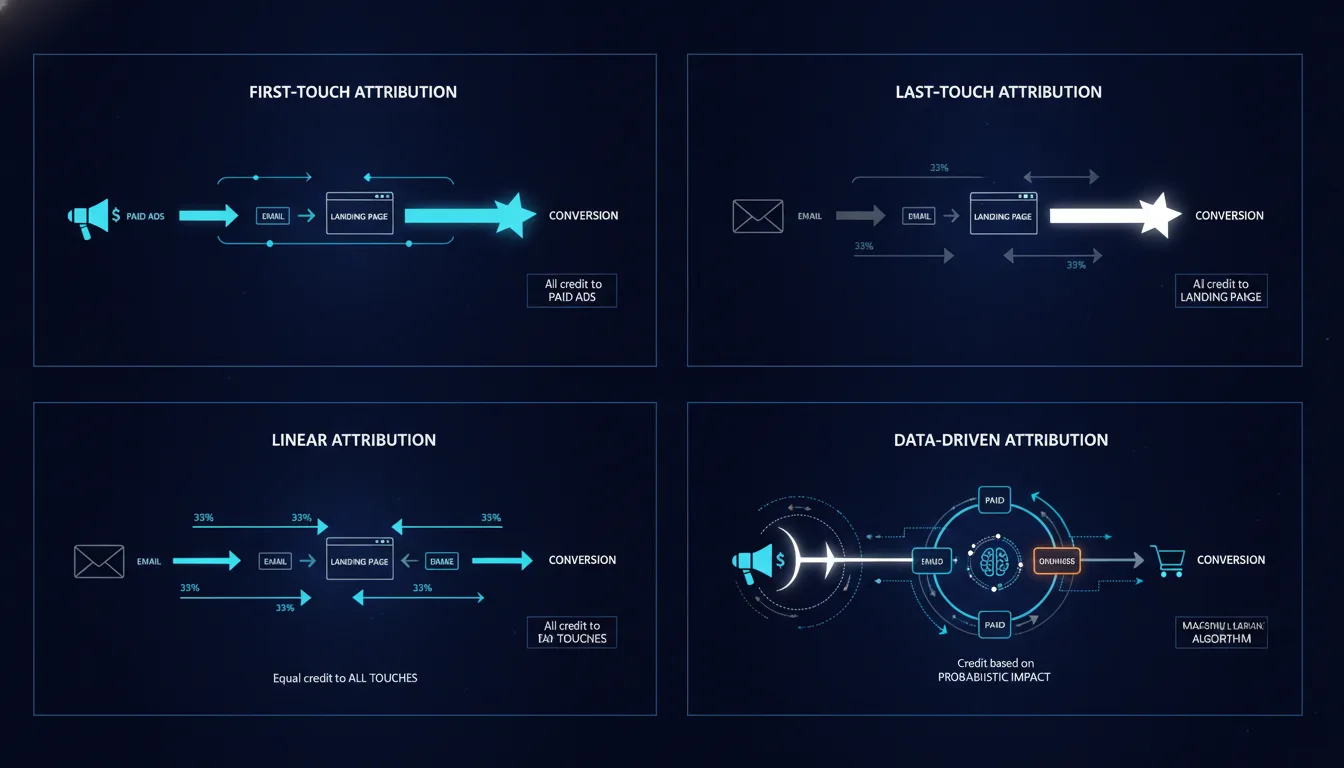
Attribution lives at the intersection of channels. A customer doesn't convert because of the ad OR the landing page OR the email. They convert because of all three, in sequence, coordinated. Siloed optimization misses this entirely.
Automation amplifies paid media ROI. The best ecommerce brands don't win on ad creative alone. They win on the sequences that come after. Email, post-purchase upsells, retargeting based on purchase history — these are force multipliers when they operate in real-time coordination with ads.
The statistics underscore the opportunity: 35% of ecommerce revenue comes from repeat purchases, yet most brands treat repeat customer marketing as an afterthought. And 68% of cart abandonment represents direct revenue leakage that can be recovered with the right automation.
Alignment unlocks both.
The Alignment Solution: One System, One Operator
The brand brought in a Brand Technical Expert whose job was singular: operate the entire ecommerce marketing system as one unit.
This was not a fractional CMO. This was not a freelancer. This was one dedicated operator with full-stack ownership of paid media, landing pages, tracking, email automation, and analytics.
The mandate was clear: align the funnel and automation so that every ad, every landing page, and every email sequence operated as parts of one system, not as independent channels.
The infrastructure powering this alignment was a managed marketing infrastructure — which meant direct API connections to Google Ads, Meta, Shopify, and the email vendor, combined with server-side conversion tracking and documented decision-making.
This is not a new idea. But it is rarely executed in ecommerce, where tradition is to hire specialist vendors instead of aligning what you already have.

Implementation: Aligning the Funnel and Automation
Phase 1: Unified Conversion Tracking
Before any optimization, the operator audited conversion tracking. They found:
Google Analytics 4 was missing 23% of ecommerce transactions because the product data layer wasn't wired correctly.
Meta was using the Facebook pixel, which had 3–5 day attribution delays due to browser-based matching.
The email vendor had no connection to purchase events, so sequences were triggered on behaviors, not outcomes.
Historical customer purchase data wasn't accessible for audience segmentation or retargeting list building.
The fix: Implement server-side tracking infrastructure that unified all conversion events into a single source of truth.
Google Conversion Linker for real-time customer ID matching
Meta Conversions API for server-validated ecommerce events
Shopify purchase hook feeding all conversions into a CDP for audience sync
Daily customer data syncs enabling historical segmentation
Result: Immediate lift in ad platform data accuracy, enabling true ROAS optimization for the first time. Within weeks, the operator could see which ad creatives, landing page variants, and traffic sources actually drove profitable orders.
Phase 2: Funnel and Landing Page Alignment
With clean conversion data, the operator audited the funnel.
The issue: Ad messaging didn't match landing page messaging. Google Ads campaigns were running headlines like "Summer Dresses Under $50." The landing pages were generic. Prospect saw an ad about a specific offer, clicked, and landed on a page about general fashion.
The operator restructured landing pages around ad-specific messaging. For every distinct ad audience and offer, a dedicated landing page or template variant was created:
New customer audience: Landing page with a first-time discount, incentive to email signup.
Past customer audience: Landing page highlighting new arrivals and loyalty rewards.
High-AOV audience: Landing page featuring premium products and bundle offers.
Cart abandoner audience: Landing page emphasizing product scarcity and review social proof.
Each landing page was wired with proper UTM tagging and conversion tracking so that every visitor, click, and purchase could be attributed to the originating ad.
Result: Landing page conversion rates increased from 3.2% to 4.8%. More importantly, the operator could now see the full funnel: which ad variants drove qualified traffic to which landing pages that converted at which rates.
Phase 3: Checkout Optimization and Cart Recovery
With the funnel aligned, the operator optimized the critical moment: the cart.
Data showed that 67% of carts were abandoned, and of those, only 19% were recovered with email. The reason: the recovery sequences were generic and slow.
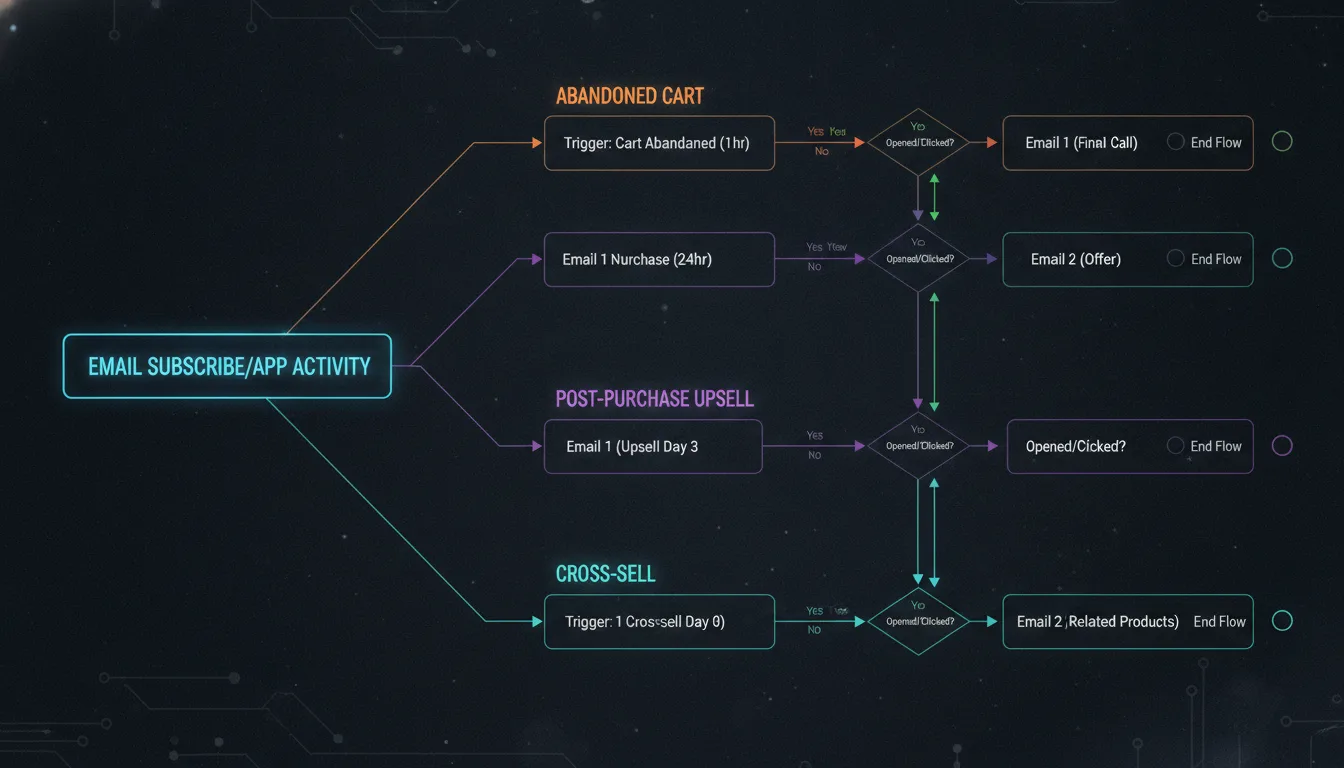
The operator implemented a multi-touch cart recovery automation that was real-time and coordinated:
1-hour trigger: Email with a "complete your order" CTA and direct product link. No discount. Many customers were just completing checkout.
24-hour trigger: Email with a small discount offer (5–10%) and trust signals (reviews, guarantee).
48-hour trigger: Last chance email with a larger discount (15%) and urgency language (limited time, low stock).
If unsubscribed at any point: Audience tag removes them from further sequences.
If purchased: Sequence terminates, customer moves to post-purchase flow.
All email sends were coordinated with conversion tracking, so the operator knew exactly which recovery email drove the purchase (essential for true attribution).
Result: Abandoned cart recovery rate improved from 19% to 28%, recovering an additional $340K in annual revenue.
Phase 4: Post-Purchase Sequences and Upsell Automation
The biggest win came from automating what happens after the purchase.
The brand had no post-purchase sequences. A customer bought and then received nothing until a generic "how was your experience" survey 30 days later.
The operator built a compounding post-purchase system:
Day 0 (immediately): Order confirmation with order tracking link.
Day 3: Delivery reminder + complementary product recommendations based on what they purchased.
Day 7 (post-delivery): Upsell email featuring products related to their purchase (customer bought a summer dress, they get shown matching accessories).
Day 14: "Complete the look" email with bundle recommendations.
Day 30: NPS survey + VIP loyalty offer for high-value customers (based on purchase history).
Critically, all product recommendations were powered by purchase history and customer segment data, not generic browse behavior.
Result: Post-purchase email click-through rate increased from 1.8% to 3.9%, and 31% of repeat purchases in the first 90 days came directly from post-purchase automation.
Phase 5: Meta and Google Ads Coordination
With funnel and email aligned, the operator optimized the paid channels themselves.
Before: The PPC agency ran Google Shopping to capture high-intent search traffic. Meta ran retargeting to past site visitors. They were separate campaigns with no coordination.
After: The operator unified audience definitions and messaging.
Google Shopping campaigns were segmented by customer type (new, repeat, high-value), and each segment had dedicated bid strategies and landing page rules.
Meta retargeting campaigns were built on precise audience segments: cart abandoners, past purchasers, past browsers, high-LTV customers. Each audience received customized messaging and product recommendations.
Cross-platform audience syncing ensured that a customer in a cart abandonment email sequence was simultaneously shown a complementary retargeting ad on Facebook (but not the same product — different angle).
Attribution windows were aligned: 30-day lookback for both platforms, 7-day conversion window for cart recovery, 14-day for post-purchase upsells.
Result: ROAS improved from 1.2x to 2.5x, and the cost per customer acquisition decreased by 31% while customer lifetime value increased by 40%.
The five phases took six months to implement fully. Weeks 1–2 were planning and audit. Weeks 3–6 were tracking infrastructure and data cleanup. Weeks 7–12 were landing page restructuring and funnel alignment. Weeks 13–20 were email automation build-out and testing. Weeks 21–24 were full-channel coordination, optimization, and documentation.
By month six, the system was live and compounding.

Results and Measured Outcomes
Six months after implementation, the metrics told the story:
Outcome | Magnitude | Business Impact |
|---|---|---|
Average Order Value | +34% | From upsell automation and complementary product recommendations in post-purchase sequences. |
ROAS (Paid Ads) | +2.1x (from 1.2x to 2.5x) | From precise audience segmentation and message-to-funnel alignment. Every ad went to a prepared landing page. |
Abandoned Cart Recovery | +47% (from 19% to 28%) | From multi-touch automated sequences. Recovered an additional $340K in annual revenue. |
Email Click-Through Rate | +124% (from 2.1% to 4.7%) | From personalization based on purchase history and coordinated send timing. |
Customer Repeat Purchase Rate (12 months) | +22% (from 28% to 34%) | From post-purchase sequences driving upsells and retention campaigns based on purchase recency. |
Customer Lifetime Value (12 months) | +40% | Combined effect of higher AOV, higher repeat rate, and lower acquisition cost. |
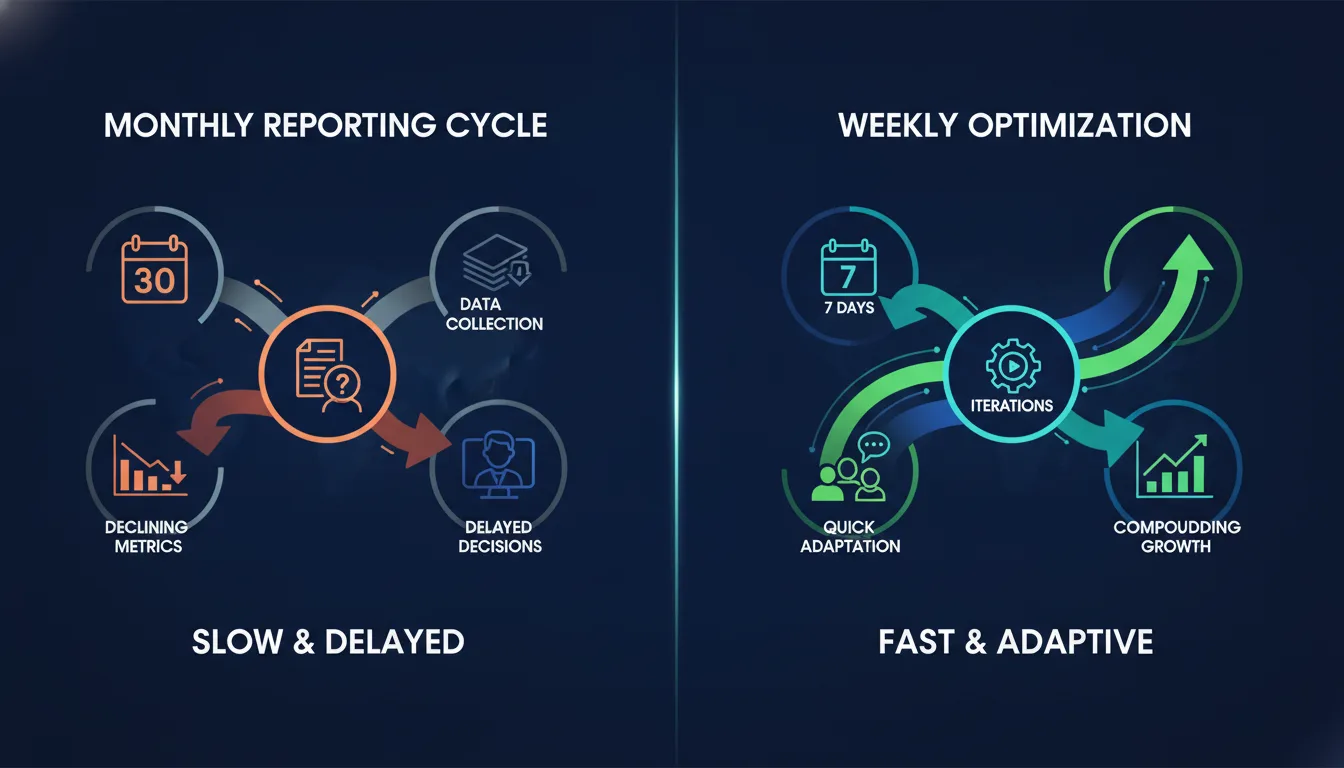
Attribution Reporting Lag | –85% (from 7–14 days to 1–2 days) | Operator could make decisions based on current data, not historical reports. |
These results represent actual measured outcomes from the case. They are illustrative of what funnel and automation alignment can unlock. Results vary based on starting point, product fit, market, and implementation rigor.
What Made This Work? The Critical Success Factors
One Operator, Full-Stack Ownership
The entire transformation happened because one person owned the entire system. No handoffs. No vendor coordination required. No "we'll discuss in next week's meeting."
When the operator identified that landing page messaging didn't match ad creative, they changed it immediately. When email open rates dropped, they could see why (because a new ad audience had different intent levels) and adjust targeting, not blame the email vendor.
This is what managed marketing infrastructure means in practice: one dedicated Brand Technical Expert with full authority and full accountability.
Infrastructure Precedes Optimization
The first 8 weeks were not spent optimizing. They were spent building a reliable data foundation.
Server-side conversion tracking that worked.
Attribution windows that were consistent across platforms.
Customer IDs that matched across systems.
Email trigger logic that fired reliably based on real ecommerce events.
Only after that infrastructure was locked did optimization begin.
This is a common mistake in ecommerce: brands try to optimize without first building data infrastructure. They run A/B tests on landing pages without understanding which traffic source each variant is getting. They launch email automation without real-time conversion feedback. The results are noise, not signal.
Infrastructure first. Then optimization.
Channel Alignment, Not Channel Independence
The operator never optimized Meta in isolation from Google. Never optimized email in isolation from ads. Never tried to max out conversion rate without considering ROAS.
Every optimization was made in the context of the full system.
When the operator restructured landing pages around ad-specific messaging, Google Shopping ROAS went up not because of the landing pages, but because of the message-match. Landing pages worked better because they were integrated with email follow-up. Email worked better because it received warm audiences from coordinated paid media.
This is the difference between optimization and alignment. Optimization makes one channel better. Alignment makes the whole system better.
Automation That Responds to Data
The email sequences weren't static. They were dynamic:
Cart recovery sequences triggered only when a cart was abandoned in real-time.
Post-purchase upsell emails were triggered based on purchase data and showed products related to what was actually bought.
Audience eligibility was constantly updated based on purchase history, email engagement, and customer lifetime value.
This required the infrastructure and the operator's attention. You cannot build dynamic automation once and let it run. It needs constant monitoring and adjustment.

Lessons for Ecommerce Brands
Lesson 1: Funnel Alignment First
Do not hire more vendors. Do not launch more campaigns. Align what you have.
Make sure every ad goes to a prepared landing page. Make sure every landing page has clear conversion tracking. Make sure every email sequence is triggered by real customer behavior, not generic guesses.
The best ecommerce brands have fewer channels, better coordinated. Worse ecommerce brands have more channels, worse coordinated.
Lesson 2: Attribution Is Infrastructure
You cannot optimize what you cannot measure. And you cannot measure accurately without:
Server-side conversion tracking that reduces attribution delay.
Customer ID matching across platforms and email systems.
Real-time data flow so that decisions are made on current data, not historical reports.
Consistent attribution windows across all channels (not 7-day for Google, 30-day for Meta, 1-day for email).
Build this first. Optimize second.
Lesson 3: Automation Compounds
A single abandoned cart recovery email might drive 8–12% recovery. But when coordinated with paid media, landing pages, and post-purchase upsells, the system effect is 3–4x the individual channel impact.
This is what alignment enables: compounding. Each part makes the others more effective.
Build this at scale, not as ad-hoc experiments.
Frequently Asked Questions
Q: How long does full funnel and automation alignment take?
A: This case study took six months from start to full implementation. Timelines vary based on starting point, stack complexity, and resource availability. The brand had clean data and a willingness to restructure quickly. Other brands might take 4 months (simpler stack) or 9 months (multiple systems, regulatory constraints). Key phases are: audit (1–2 weeks), infrastructure build (6–8 weeks), funnel restructure (8–10 weeks), automation (6–8 weeks), optimization (4–6 weeks).
Q: Do we need to replace our current vendors (email platform, landing page builder, ad platform)?
A: Not necessarily. This case study did not replace Google, Meta, or Shopify. What changed was the operator structure and coordination. You may eventually consolidate, but the real win is alignment, not replacement. That said, some vendors are harder to integrate than others. Email platforms with strong API access and custom trigger capabilities work better than basic newsletter tools. Landing page builders with UTM support and conversion event firing work better than static builders.
Q: What skills does a Brand Technical Expert need to pull this off?
A: This person needs to be part marketer, part analyst, part operator. They need to understand paid media strategy, funnel design, email marketing fundamentals, Google Analytics/GA4, basic data infrastructure concepts, and how to coordinate across teams. They do not need to be a developer. They do need to be comfortable learning APIs, reading documentation, and troubleshooting data flow issues. The best candidates are people who have worn multiple marketing hats and understand systems thinking.
Q: How much does setting up this type of infrastructure cost?
A: Direct software costs are minimal if you stick with standard platforms (Google Ads, Meta, Shopify, a CDP or customer data sync tool). The real cost is the operator's time and expertise. Hiring a fractional Brand Technical Expert or managed infrastructure provider typically ranges from $3,500 to $8,000+ per month depending on scope and geographical market. In this case, the brand recovered $340K in cart abandonment revenue alone in the first six months, making ROI on that investment immediate.
Q: Can we do this with our current internal marketing team, or do we need an external operator?
A: This depends on your team's existing skills and bandwidth. If you have someone with full-stack ecommerce marketing experience and capacity to own this (not juggling other projects), you can hire that person. If you don't, external expertise often moves faster because there is zero context cost and no competing priorities. This brand chose an external operator through a managed infrastructure provider, which meant they could keep their internal team focused on strategy and creative while the operator handled execution and optimization.
Q: What if our conversion tracking is already a mess? Where do we start?
A: Start with an audit. Map every pixel, every UTM parameter, every conversion event definition. You will likely find missing data, inconsistent definitions, and broken connections. Before you change anything, measure what is already happening. Then implement server-side tracking infrastructure and customer ID matching. This is not glamorous work, but it is load-bearing. Do not skip it.
Q: What metrics should we track to know if alignment is working?
A: Track three categories: (1) Ecommerce outcomes (AOV, repeat purchase rate, customer lifetime value, cart abandonment recovery). (2) Channel efficiency (ROAS, cost per acquisition, email engagement rates). (3) System health (attribution accuracy, data freshness, sequence delivery rates, unsubscribe rates). Success is when your ecommerce outcomes improve, not when any single channel metric maxes out.
Q: If we only have resources for one improvement, should we focus on funnel alignment, email automation, or ads?
A: Start with conversion tracking and funnel alignment. If your data is broken, nothing else compounds. If your ads and landing pages are not coordinated, email sequences will optimize for the wrong signals. Get the foundation right first: clean tracking, aligned messaging, predictable conversion flow. Only then layer in email automation and cross-channel optimization.
Next Steps: Is This Right for Your Brand?
This case study represents a specific outcome under specific conditions. Your brand may have different products, different customer acquisition sources, different email infrastructure, and different business model.
But the principle holds: fragmented channels create fragmented results. Aligned channels create compounding results.
If your ecommerce brand fits this profile, alignment is worth serious consideration:
You are generating $2M+ in annual revenue and hitting a growth ceiling.
You have multiple vendors (PPC, email, analytics) that do not talk to each other.
Your founder or CMO is manually stitching together reports.
You are profitable but feel like there is money left on the table in abandoned carts, repeat purchases, or post-purchase upsells.
You want someone who owns the entire system, not departments of specialists.
If that is you, the next step is a strategy call. We can audit your current stack, identify the highest-leverage alignment opportunities, and map out a timeline.
Schedule a brief conversation with our team. Or view more case studies to see how other growth-stage brands approached this.

Jeremiah Shaw
CEO & Technical Marketing Specialist · Metrics Masters | Brandlio
International
Technical marketing specialist pushing boundaries in Google Ads, automation, and AI-driven growth systems. Paragliding and adventure enthusiast.